Wednesday, November 20, 2013

BIVARIATE CHOROPLETH MAP

 
A bivariate map is a type of choropleth variables on a single map that strives towards illustrating a particular map though graphics that use different symbols to explain different information.
 
 
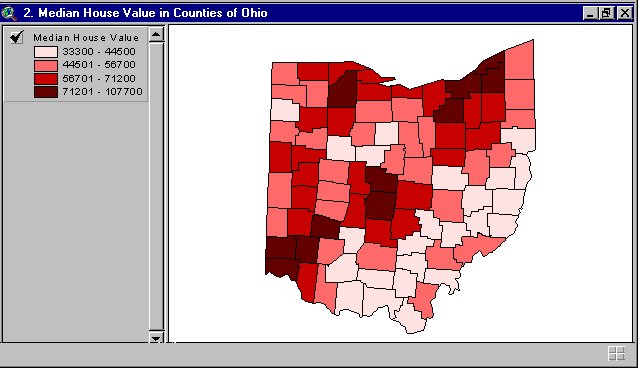
This map shows the median house value in counties of Ohio using 4 different colors.


UNIVARIATE CHOROPLETH MAP


A Univariate Choropleth map is a type of choropleth map that displays a single variable.


This map shows in 5 different colors, percentages of individuals, through out the U.S.

NOMINAL AREA CHOROPLETH MAP


This is a type of choropleth map that displays nominal data.  This map shows the minority group with the highest percent of state population.  It uses 5 different colors to represent different races.


ACCUMULATIVE LINE GRAPH OR LORENZ CURVE


Accumulative line graph or Lorenz curve is a graphical representation of the cumulative distribution function of a probability distribution. It was developed by Max O. Lorenz in 1905 for representing income distribution.  This map illustrates the % of income and % of households.

INDEX VALUE PLOT


An index value plot is a type of visualization map in which an index value, instead of an absolute value, is plotted on a line graph. This map shows the average stream flow index in North Carolina and ranged from mid February to the each of March. The average stream flow index is plotted based upon particular days of the week and the number value of comparison is 4.

BILATERAL GRAPH


A bilateral graph displays two or more related data sets through one of several means. This is a type of bilateral graph showing the relationship between Trainees, Experts, and JOCVs.


Tuesday, November 19, 2013

SCATTERPLOT


A scatter plot is a graph made by plotting ordered pairs in a coordinate plane to show the correlation between two sets of data.  A scatter plot describes a positive trend if, as one set of values increases, the other set tends to increase.  This positive trend is shown in the map below, as the days increase, so does the weight.