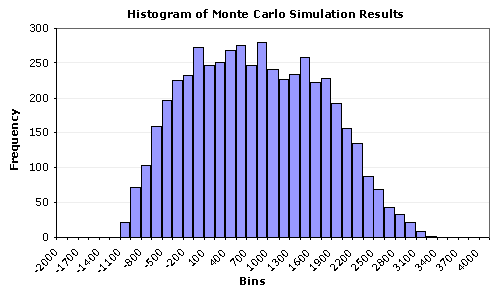
A Histogram is a bar graph of a
frequency distribution in which the widths of the bars are proportional
to the classes into which the variable has been divided and the heights of
the bars are proportional to the class frequencies. A histogram is made up of columns plotted on a graph.
This map shows the Monte Carlo simulation results.

No comments:
Post a Comment